Browsed by
Tag: income

Our Economic Malaise Is Impacting Young Workers the Most – Article by Ryan McMaken

Our Economic Malaise Is Impacting Young Workers the Most – Article by Ryan McMaken

The New Renaissance Hat
Ryan McMaken
******************************

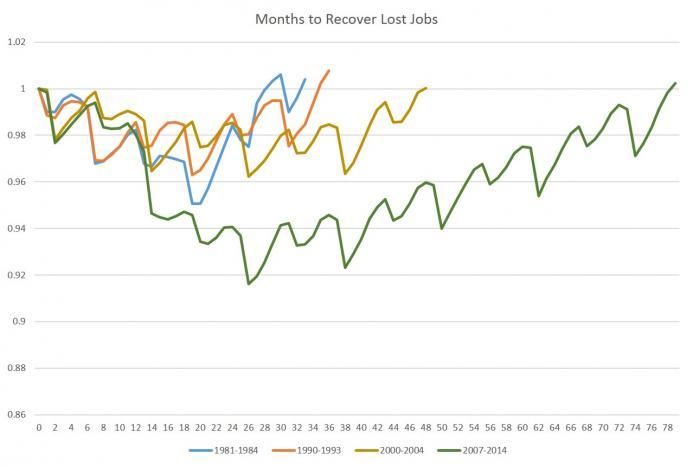
In the wake of the 2007-2009 recession, 78 months passed before employment returned to where it had been before the crisis. This was, by far, the longest period needed to recover from job losses in decades. The second-longest period needed to recover jobs occurred after the 2002 recession when about 50 months were needed to recover lost jobs:

economic_malaise_young_people_1

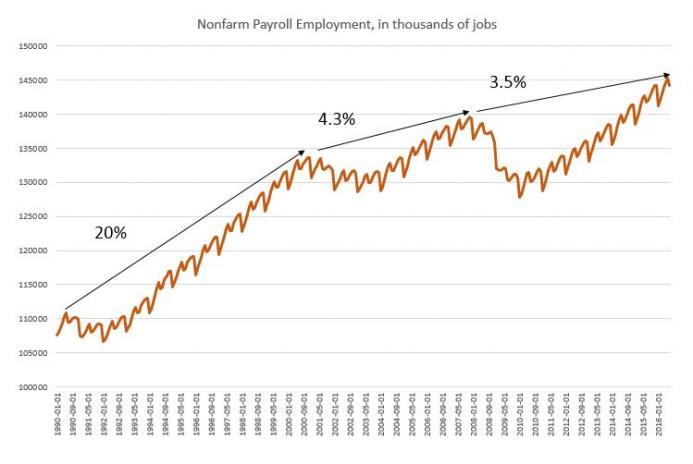
Moreover, we see that in recent cycles, job growth during each recovery has been getting weaker and weaker over time:

economic_malaise_young_people_2

Some observers of the rose-colored-glasses-wearing variety have attempted to explain away the most recent malaise in job gains by claiming that fewer jobs are needed because so many Baby Boomers are aging out of the work force, and because people are so much wealthier, they argue, workers are leaving the labor force for non-economic reasons. That is, people are leaving the labor force for reasons other than being discouraged workers.

These claims are plausible, but the empirical data we have does not support them.

Keep in mind that ever since the 2007-2009 recession, the U-6 unemployment rate, which includes underemployed workers (i.e., involuntary part timers) and discourage workers, has reached multi-decade highs in recent years, and even now, is only at levels seen during the worst of the last recession:

economic_malaise_young_people_3

This is not simply a matter of fewer jobs being created because workers are going away.

To get a sense of the situation, we have to first look at the demographics of the working age population and the labor force.

(This demographic data on the working-age population is only currently available through the first quarter of 2015, so the time series ends in early 2015.)

economic_malaise_young_people_4

The top line is the total working age population (ages 15-65) published by the OECD and the World Bank. According to this measure, there is no decline in the working age population.

If people were aging out of the work force in droves to the point of driving a net exodus, we would see a downturn in the blue line. We don’t see that. In fact, from the beginning of the last recession at the end of 2007 to the first quarter of 2015, the working age population increased by 7.5 million people.

During that same period, the US economy added 801,000 jobs. That is, after the initial loss of 10 million jobs, the US economy began to add jobs again, but after more than seven full years, had only added a net of 801,000 jobs.

But maybe only 801,000 jobs were added because very few of those 7.5 million people wanted to be in the work force.

Well, it’s a safe bet that not all of them wanted to be in the work force, but we do know that using the standard BLS measure for the work force that 2.4 million people entered the work force during the period when only 801,000 jobs were added. (See the green line above.) That means over that time period, you had 1.6 million new people in the labor force while half that many jobs were added.

And this labor force measure only takes into account active job seekers and employed people. It ignores discouraged workers and involuntary part timers.

So we find that both the official labor force and the working age population were increasing at levels substantially above the employment levels.

Indeed, the only way we can find a number that suggests more jobs were added than workers is to look at the working-age population for ages between 25 and 54. That is, if we exclude all potential workers under 25 and all above 54, then yes, the working age population did decline by 1 million jobs. (See the red line above.)

In real life, though, the work force includes quite a few people who are, say, 22 years old, and quite a few who are 60 years old. If those people are included, the working age population is growing considerably.

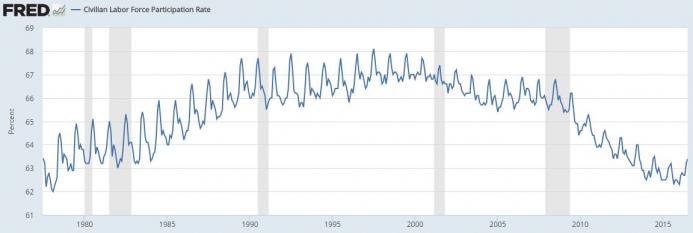
Meanwhile, workforce participation has been falling for a number of years, and is now at some of the lowest levels that have been seen in more than 30 years. From 2014 to 2016, work force participation ranged from about 62 percent to 64 percent. That’s the lowest participation rate seen since the the early 1980s.

economic_malaise_young_people_5

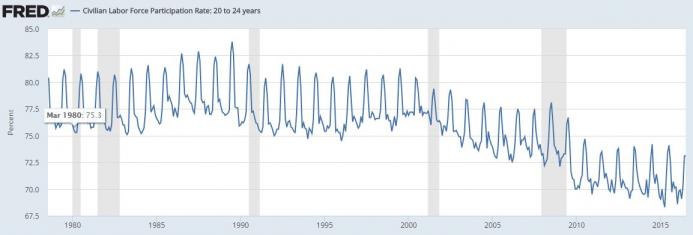
Many have assumed this means that many older workers are leaving the work force. Unfortunately, it seems that it is young workers who are most likely to leave the labor force, which is problematic for future productivity. For young workers in the 20-24 age range, work force participation has been falling for more than a decade, and fell off significantly during the last recession:

economic_malaise_young_people_6

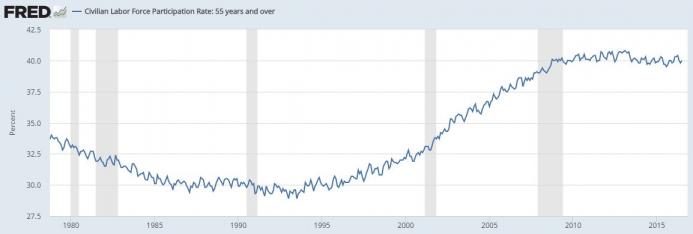
Meanwhile, labor force participation for 55-and-older individuals has held steady:

economic_malaise_young_people_7

It appears unlikely that it is now unnecessary to add jobs at a rate comparable to past recoveries because so many older workers are leaving the work force. Nor is it likely that young people are leaving the work force because they are so prosperous. It’s more likely that young people are leaving the work force as discouraged workers.

This supposition is further strengthened by the fact that the unemployment rate in the 16-24 age range has been above 10 percent for the past nine years. It was especially high even before the last recession.

But, unemployment among over-55 workers is among the lowest of all demographic groups, with a rate between 3 percent and 4 percent in recent years.

In other words, older workers are sticking around and doing relatively well. It appears that younger workers, meanwhile, are more likely to be unemployed, underemployed, or even totally out of the workforce as discouraged workers.

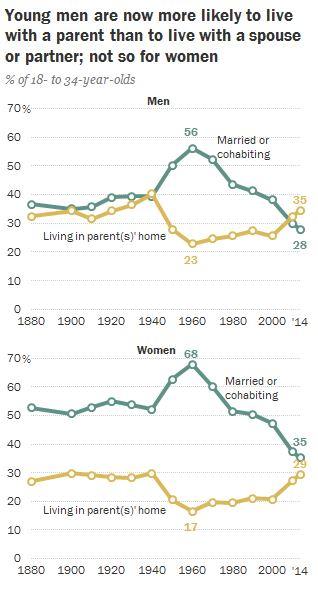
One phenomenon that gives us a reason to think this is the fact that the number of young people living with their parents has reached historic highs in the United States. As Pew recently reported:

In 2014, for the first time in more than 130 years, adults ages 18 to 34 were slightly more likely to be living in their parents’ home than they were to be living with a spouse or partner in their own household.

Living at home is more likely for men than for women, but in both cases, more young people are living with their parents than during any other period since World War II:

economic_malaise_young_people_8

Those who attempt to spin the current job numbers as simply the effects of people happily leaving the work force appear to be mistaken in assuming that older workers are leaving, and that younger workers need not work because they’re so unusually productive.

If young workers were so productive, is it too much to believe that they would choose to rent an apartment rather than live with their parents?

Once we look a the demographics behind the current job numbers, we actually find the situation is more alarming that we might have thought otherwise. We seem to be in a situation where younger workers are participating in the work force less, and putting off acquiring essential job skills that will lead to more productivity later.

Older workers are still sticking around in numbers large enough to keep the overall labor force number growing.

However, while both the working age population and the labor force are growing, overall job creation simply is not keeping up.

At some point, those 30-year olds living with their parents are doing to need full-time work, but will they have the job experience necessary (and thus the productivity) necessary to support the lifestyle to which they have become accustomed?

Or, will they simply enter the workforce with few job skills following a decade of part-time work or no work forced on them by our weak economy? When that happens, we’re likely to see a continued decline in the household and personal incomes.

Ryan W. McMaken is the editor of Mises Daily and The Free Market. He has degrees in economics and political science from the University of Colorado, and was the economist for the Colorado Division of Housing from 2009 to 2014. He is the author of Commie Cowboys: The Bourgeoisie and the Nation-State in the Western Genre. 

This article was published on Mises.org and may be freely distributed, subject to a Creative Commons Attribution United States License, which requires that credit be given to the author.
We’re Going Deeper into Debt as Real Incomes Fall – Article by Victor Xing

We’re Going Deeper into Debt as Real Incomes Fall – Article by Victor Xing

The New Renaissance HatVictor Xing

New York Fed President Dudley recently commented that “real consumer spending growth appears to have moderated somewhat from the relatively robust pace of the second half of 2015.” While this may suggest headwinds from cyclical economic conditions, there are emerging signs that ultra-accommodative policy also acts as a constraint on consumer spending via income effects. Instead of inducing savers to spend and borrow, rapid asset price appreciation as a result of monetary easing has outpaced wage growth, and pass-through services inflation subsequently reduced discretionary income and forced already-levered consumers to save instead of spend. This unintended consequence worked against accommodative policy’s desired substitution effects and suggests further easing would likely yield diminishing results if asset price appreciation continues to outpace real income growth.

Asset Price and Services Inflation Outpaced Real Wage Growth
Post-2008 policy accommodation broadly lowered funding costs for consumers and businesses to supported asset price appreciation. However, rising prices have also made assets less affordable, and home buyers “priced out” of their respective housing markets subsequently became involuntary renters. Not only do they not benefit from rising home values, higher education, and medical care inflation also outpaced aggregate real wage growth (Chart 1) to weigh on renters’ discretionary spending.

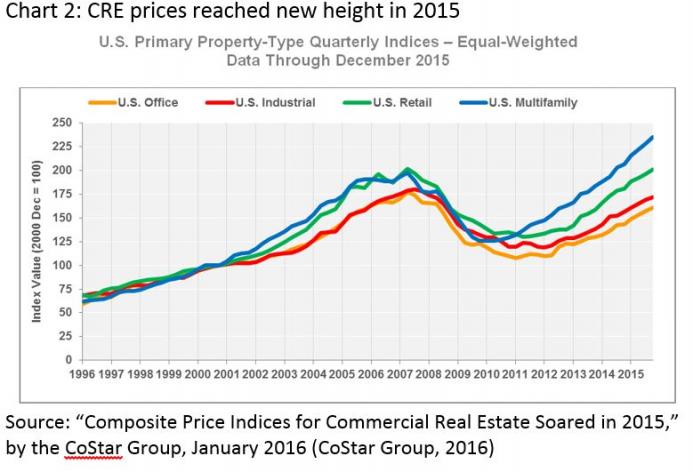
xing1In response with rising commercial real estate prices (Chart 2), businesses also pass on higher operating costs in the form of services inflation. Year-over-year personal consumption expenditure — services (chain-type price index) has been well-anchored in the 2% range (2.13% in Feb 2016) since 4Q 2011.

xing2Another factor constraining consumer spending is the well-publicized effect of student debt burden. This supports a view that household spending may be at a lower potential than during prior cycles, thus magnifying the costs of higher services inflation as a result of asset price appreciation.

Consumers Redlining their Engines: Inability To Pay $400 Emergency Expense
Accommodative monetary policy encourages consumers to spend and borrow rather than hoarding cash. However, cash-strapped consumers already facing the pressure of debt burden would likely do neither.

Federal Reserve’s recent Report on the Economic Well-Being of U.S. Households highlighted signs that some consumers are already stretching their spending power to meet existing obligations. 47% of respondents reported that a $400 emergency expense would be “more challenging to handle” (unable to use cash or a credit card that they pay off at the end of the mouth). Results from middle-income household with $40,000 to $100,000 annual income were similarly downbeat, where 44% of respondents indicated difficulties (Chart 3).

Chart 3: Percent of respondents who would completely pay an emergency expense that costs $400 using cash or a credit card that they pay off at the end of the month (by race/ethnicity and household income)

xing3Source: Federal Reserve Board of Governors

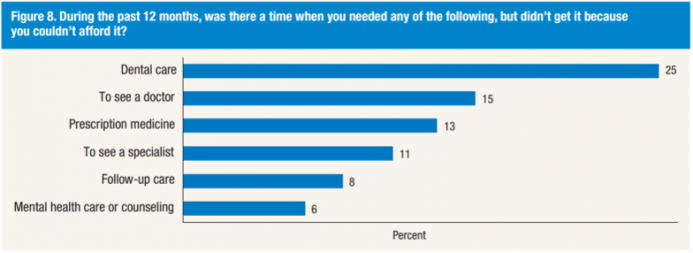
Chart 4: During the past 12 months, was there a time when you needed any of the following, but didn’t get it because you couldn’t afford it?

xing4Source: Federal Reserve Board of Governors

A survey on health-care expenses was also discouraging. 31% of respondents reported going without some type of medical care in the preceding 12 months due to inability to afford the cost. 45% of those surveyed under a household income of $40,000 reported similar decisions to defer treatment.

In the section “spending relative to income,” Fed researchers reported that one-in-five respondents with spending exceeded their income (leveraged spending). These are signs that consumers were taking advantage of lower rates, but the spending does not appear to be sustainable without corresponding rise in real wage growth.

Rising Renter Cost Burden
Another factor constraining discretionary spending is rising renter cost burden. The Harvard Joint Center for Housing Studies projected a “fairly bleak picture of severe renter burden across the U.S. for the coming decade.” The report acknowledged falling incomes among renters and the persisting gap between renter income and renter housing costs (Chart 6), as well as severely burdened renter households (housing costs of more than 50% of household income) reaching 11.8 million in 2015 (Chart 7), or about one in four renters.

Assuming the correlation between rental price inflation and asset price inflation holds, further declines in housing affordability as a result of policy easing would exacerbate renter burden — one likely needs rising real wages to offset.

Chart 5: In the past 12 months, would you say that your household’s total spending was more, less, or the same as your income? (by household income)

xing5Source: Federal Reserve Board of Governors

xing6xing7

Impacts of “Long and Variable Lags” Between Asset Price Inflation and Real Wage Growth
Financial market participants play an essential role in the transmission of Federal Reserve’s monetary policy by affecting financial conditions — the following components are part of the GS Financial Conditions Index:

  • Short-term bond yield
  • Long-term corporate credit spread
  • Stock market variable
  • Exchange rate

The Federal Reserve only has effective control of the very front-end of the Treasury curve via conventional monetary policy. Nevertheless, unconventional policies such as QE, as well as forward guidance on SOMA principal reinvestments also allow the central bank to affect longer-term funding costs via the expectations and “recruitment channel.” Under this mechanism, asset prices take little time to react to changing policy stances, while impacts on income growth and economic conditions would often take longer to manifest.

Such lag between asset price appreciation and changing economic conditions carries a hidden cost — if asset price inflation becomes well entrenched ahead of broad-based economic growth, those without assets would be penalized just to maintain their life-style, and the reduction in their discretionary spending would serve as a disinflationary drag to Federal Reserve’s effort to reflate the economy.

Conclusion
Inefficiencies within the monetary policy transmission mechanism have resulted in income effects becoming greater than the substitution effects. Under this scenario, ultra-accommodative policy may induce further saving by asset-less consumers to further weigh on aggregate demand. Additionally, policymakers should exercise caution if increasingly aggressive and unconventional reflationary policies do not yield intended results.

Victor Xing is founder and investment analyst at Kekselias, Inc. He is formerly a fixed-income trading analyst for the Capital Group Companies with 5 years of experience on its interest rates trading desk.

This article was published on Mises.org and may be freely distributed, subject to a Creative Commons Attribution United States License, which requires that credit be given to the author.

Capitalism Promotes Equality – Article by Barry Brownstein

Capitalism Promotes Equality – Article by Barry Brownstein

The New Renaissance HatBarry Brownstein
******************************

Equality in Consumption Is Now the Norm

Highway traffic began to slow outside of Boston as we made our way to the airport. My wife was driving, so I took out my $100 Android phone and opened Google Maps. Google Traffic instantly showed me, in real time, the best route to avoid delays and estimated the number of minutes we’d save by altering our route. Thanks to Google, there was no threat of missing our flight.

It was not too long ago that we relied on traffic reporters in helicopters, and their advice was often useless by the time we heard their updates.

Have you wondered how Google Traffic does it? The answer is crowdsourcing. If you are among the two-thirds of American adults who own a smartphone, and if the GPS locator on your phone is enabled, you are generating real-time traffic information. Google Traffic measures how fast cars are moving compared to normal speeds and generates location-specific reports.

Rich or poor, most of the drivers on the highway that day had access to the same miraculous traffic report and the same opportunity to make better driving decisions. This is just one example of how the marketplace generates equality in consumption.

The cars we drive are another indicator of consumption equality. We were driving an inexpensive Subaru Outback. There are more expensive, comfortable, and bigger cars on the market, but the Insurance Institute for Highway Safety says that there are none safer than the Outback.

Would a rich individual, on this same drive to the airport, have any noticeable advantages over me? He or she could hire a driver and use the drive time for something more productive, but even that advantage will dwindle as driverless cars become the norm.

In his Wall Street Journal commentary “The Rise of Consumption Equality,” former hedge fund manager Andy Kessler writes:

Just about every product or service that makes our lives better requires a mass market or it’s not economic to bother offering. Those who invent and produce for the mass market get rich. And the more these innovators better the rest of our lives, the richer they get but the less they can differentiate themselves from the masses whose wants they serve.

“What does Google founder Larry Page have that you don’t have?” Kessler asks pointedly.

Page’s income is unimaginably larger than most of ours. But in terms of consumption, the differences are negligible — which is remarkable, given how much Page and Google have improved our lives.

All-time football great Tom Brady earns roughly $10 million a year. His diet made the news recently. Does Brady enjoy health advantages not available to Americans with a fraction of his income? Brady hires a cook. Our family doesn’t do that, but we eat much like Brady — organic vegetables, fruits, whole grains, beans, and fish make up the bulk of our diet. From May to October, a local organic farmer provides an abundance of vegetables that are picked fresh for us based on an order we place the day before. In the summertime, our produce may be fresher than Brady’s. Compared to any of us, what real dietary advantage does Tom Brady’s income afford him? It is his commitment to a healthy lifestyle, not his income, that makes the difference.

In 1900, Americans spent approximately 50 percent of their household income on food and clothing; today, we spend closer to 20 percent. Today, fresh produce from all over the world, not even available to a king a century ago, awaits common consumers when they enter the supermarket.

In 1900, only 25 percent of households had running water; fewer still had flush toilets. It would be decades before such wonders as electricity, automobiles, and indoor plumbing were ubiquitous. The faucets in the famed Hearst Castle in California may have been gold plated, but was the water any better than what the average household received? The water running in my home comes from an artesian well over 400 feet deep. More evidence of consumption equality: my water is every bit as good, if not better, than a billionaire’s in a big city penthouse.

Wealth is not a good predictor of a rich life. Psychology professor Sonja Lyubomirsky found that only 10 percent of the variance in Americans’ happiness is due to income and other circumstances. “Happiness more than anything,” she writes in her book The How of Happiness, ”is a state-of-mind, a way of perceiving and approaching ourselves and the world in which we reside.”

And what of the elements of emotional intelligence that make life richer? In the book Big Magic, best-selling author Elizabeth Gilbert observes:

If money were the only thing people needed to live rich creative lives, then the mega-rich would be the most imaginative, generative, and original thinkers among us, and they simply are not. The essential ingredients for creativity remain exactly the same for everybody: courage, enchantment, permission, persistence, trust — and those elements are universally accessible. Which does not mean that creative living is always easy; it merely means that creative living is always possible.

The same universally accessible elements are essential ingredients for entrepreneurship. Entrepreneurs persist, driven by their vision and by the equality of opportunity that capitalism affords. The entrepreneur’s choice to be persistent and courageous is the not-so-secret engine that drives success.

The essential consumption goods we couldn’t even imagine a hundred years ago are almost universally available in the United States today. The marketplace, aided by many creative, pioneering entrepreneurs and every person who strives to put in a good day’s work, is generating consumption equality.

Barry Brownstein is professor emeritus of economics and leadership at the University of Baltimore. He is the author of The Inner-Work of Leadership. He blogs at BarryBrownstein.com, Giving up Control, and America’s Highest Purpose.

This article was published by The Foundation for Economic Education and may be freely distributed, subject to a Creative Commons Attribution 4.0 International License, which requires that credit be given to the author.

What Are Your Odds of Making It to the 1%? – Article by Chelsea Follett

What Are Your Odds of Making It to the 1%? – Article by Chelsea Follett

The New Renaissance HatChelsea Follett
******************************

They’re better than you think

Your odds of “making it to the top” might be better than you think, although it’s tough to stay on top once you get there.

According to research from Cornell University, over 50 percent of Americans find themselves among the top 10 percent of income-earners for at least one year during their working lives. Over 11 percent of Americans will be counted among the top 1 percent of income-earners (i.e., people making at minimum $332,000) for at least one year.

How is this possible? Simple: the rate of turnover in these groups is extremely high.

Just how high? Some 94 percent of Americans who reach “top 1 percent” income status will enjoy it for only a single year. Approximately 99 percent will lose their “top 1 percent” status within a decade.

Now consider the top 400 U.S. income-earners — a far more exclusive club than the top 1 percent. Between 1992 and 2013, 72 percent of the top 400 retained that title for no more than a year. Over 97 percent retained it for no more than a decade.

HumanProgress.org advisory board member Mark Perry put it well in his recent blog post on this subject:

Whenever we hear commentary about the top or bottom income quintiles, or the top or bottom X% of Americans by income (or the Top 400 taxpayers), a common assumption is that those are static, closed, private clubs with very little dynamic turnover. …

But economic reality is very different — people move up and down the income quintiles and percentile groups throughout their careers and lives.

What if we look at economic mobility in terms of accumulated wealth, instead of just annual income (as the latter tends to fluctuate more)?

The Forbes 400 lists the wealthiest Americans by total estimated net worth, regardless of their income during any given year. Over 71 percent of Forbes 400 listees — and their heirs — lost their top 400 status between 1982 and 2014.

heirsSo, the next time you find yourself discussing the very richest Americans, whether by wealth or income, keep in mind the extraordinarily high rate of turnover among them.

And even if you never become one of the 11.1 percent of Americans who fleetingly find themselves in the “top 1 percent” of US income-earners, you’re still quite possibly part of the global top 1 percent.

Cross-posted from HumanProgress.org.

Chelsea Follett (Chelsea German) works at the Cato Institute as a Researcher and Managing Editor of HumanProgress.org.

This article was published by The Foundation for Economic Education and may be freely distributed, subject to a Creative Commons Attribution 4.0 International License, which requires that credit be given to the author.

Heterogeneity: A Capital Idea! – Article by Sanford Ikeda

Heterogeneity: A Capital Idea! – Article by Sanford Ikeda

The New Renaissance Hat
Sanford Ikeda
June 26, 2014
******************************

When Thomas Piketty’s Capital in the 21st Century was released in English earlier this year it sparked vigorous debate on the issue of wealth inequality. Despite the prominence of the word in the title, however, capital has not itself become a hot topic. Apparently none of his defenders have taken the opportunity to explore capital theory, and, with a few exceptions, neither have his critics.

To prepare to read Mr. Piketty’s book I’ve been studying Ludwig Lachmann’s Capital and Its Structure, which, along with Israel M. Kirzner’s Essay on Capital, is among the clearest expositions of Austrian capital theory around. A hundred years ago the “Austrian economists”—i.e. scholars such as Eugen von Böhm-Bawerk who worked in the tradition of Carl Menger—were renowned for their contributions to the theory of capital. Today capital theory is still an essential part of modern Austrian economics, but few others delve into its complexities. Why bother?

Capital is Heterogeneous


Among the Austrians, Böhm-Bawerk viewed capital as “produced means of production” and for Ludwig von Mises “capital goods are intermediary steps on the way toward a definite goal.” (Israel Kirzner uses the metaphor of a “half-baked cake.”)  Lachmann then places capital goods in the context of a person’s plan: “production plans are the primary object of the theory of capital.” You can combine capital goods in only a limited number of ways within a particular plan. Capital goods then aren’t perfect substitutes for one another. Capital is heterogeneous.

Now, mainstream economics treats capital as a homogenous glob. For instance, both micro- and macroeconomists typically assume Output (Q) is a mathematical function of several factor inputs, e.g. Labor (L) and Capital (K) or

Q = f(L,K).

In this function, not only is output homogenous (whether we’re talking about ball-bearings produced by one firm or all the goods produced by all firms in an economy) but so are all labor inputs and all capital inputs used to produce them. In particular, any capital good can substitute perfectly for any other capital good in a firm or across all firms. A hammer can perfectly replace, say, a helicopter or even a harbor.

On the other hand, capital heterogeneity implies several things.

First, according to Mises, heterogeneity means that, “All capital goods have a more or less specific character.” A capital good can’t be used for just any purpose:  A hammer generally can’t be used as a harbor. Second, to make a capital good productive a person needs to combine it with other capital goods in ways that are complementary within her plan: Hammers and harbors could be used together to help repair a boat. And third, heterogeneity means that capital goods have no common unit of measurement, which poses a problem if you want to add up how much capital you have:  One tractor plus two computers plus three nails doesn’t give you “six units” of capital.

Isn’t “money capital” homogeneous? The monetary equivalent of one’s stock of capital, say $50,000, may be useful for accounting purposes, but that sum isn’t itself a combination of capital goods in a production process. If you want to buy $50,000 worth of capital you don’t go to the store and order “Six units of capital please!” Instead, you buy specific units of capital according to your business plan.

At first blush it might seem that labor is also heterogeneous. After all, you can’t substitute a chemical engineer for a pediatrician, can you? But in economics we differentiate between pure “labor” from the specific skills and know-how a person possesses. Take those away—what we call “human capital”—and then indeed one unit of labor could substitute for any other. The same goes for other inputs such as land. What prevents an input from substituting for another, other than distance in time and space, is precisely its capital character.

One more thing. We’re talking about the subjective not the objective properties of a capital good. That is, what makes an object a hammer and not something else is the use to which you put it. That means that physical heterogeneity is not the point, but rather heterogeneity in use. As Lachmann puts it, “Even in a building which consisted of stones completely alike these stones would have different functions.” Some stones serve as wall elements, others as foundation, etc. By the same token, physically dissimilar capital goods might be substitutes for each other. A chair might sometimes also make a good stepladder.

But, again, what practical difference does it make whether we treat capital as heterogeneous or homogenous? Here, briefly, are a few consequences.

Investment Capital and Income Flows


When economists talk about “returns to capital” they often do so as if income “flows” automatically from an investment in capital goods. As Lachmann says:

In most of the theories currently in fashion economic progress is apparently regarded as the automatic outcome of capital investment, “autonomous” or otherwise. Perhaps we should not be surprised at this fact: mechanistic theories are bound to produce results that look automatic.

But if capital goods are heterogeneous, then whether or not you earn an income from them depends crucially on what kinds of capital goods you buy and exactly how you combine them, and in turn how that combination has to complement the combinations that others have put together. You build an office-cleaning business in the hopes that someone else has built an office to clean.

There’s nothing automatic about it; error is always a possibility. Which brings up another implication.

Entrepreneurship


Lachmann:

We are living in a world of unexpected change; hence capital combinations, and with them the capital structure, will be ever changing, will be dissolved and re-formed. In this activity we find the real function of the entrepreneur.

We don’t invest blindly. We combine capital goods using, among other things, the prices of inputs and outputs that we note from the past and the prices of those things we expect to see in the future. Again, it’s not automatic. It takes entrepreneurship, including awareness and vision. But in the real world—a world very different from the models of too many economists—unexpected change happens. And when it happens the entrepreneur has to adjust appropriately, otherwise the usefulness of her capital combinations evaporates. But that’s the strength of the market process.

A progressive economy is not an economy in which no capital is ever lost, but an economy which can afford to lose capital because the productive opportunities revealed by the loss are vigorously exploited.

In a dynamic economy, entrepreneurs are able to recombine capital goods to create value faster than it disappears.

Stimulus Spending


As the economist Roger Garrison notes, Keynes’s macroeconomics is based on labor, not capital. And when capital does enter his analysis Keynes regarded it the same way as mainstream economics: as a homogeneous glob.

Thus modern Keynesians, such as Paul Krugman, want to cure recessions by government “stimulus” spending, without much or any regard to what it is spent on, whether hammers or harbors. (Here is just one example.)  But the solution to a recession is not to indiscriminately increase overall spending. The solution is to enable people to use their local knowledge to invest in capital goods that complement existing capital combinations, within what Lachmann calls the capital structure, in a way that will satisfy actual demand. (That is why economist Robert Higgs emphasizes “real net private business investment” as an important indicator of economic activity.)  The government doesn’t know what those combinations are, only local entrepreneurs know, but its spending patterns certainly can and do prevent the right capital structures from emerging.

Finally, no one can usefully analyze the real world without abstracting from it. It’s a necessary tradeoff. For some purposes smoothing the heterogeneity out of capital may be helpful. Too often though the cost is just too high.

Sanford Ikeda is an associate professor of economics at Purchase College, SUNY, and the author of The Dynamics of the Mixed Economy: Toward a Theory of Interventionism.
***
This article was originally published by The Foundation for Economic Education.
A College Degree Does Not Make You a Million Dollars – Article by Andrew Syrios

A College Degree Does Not Make You a Million Dollars – Article by Andrew Syrios

The New Renaissance Hat
Andrew Syrios
April 13, 2014
******************************

It is becoming substantially less difficult these days to convince people that college is not a sure fire way to the good life. Even Paul Krugman has conceded that “it’s no longer true that having a college degree guarantees that you’ll get a good job.” You can say that again: 53 percent of recent graduates are either jobless or underemployed. Unfortunately, myths die hard. Many people still believe as Hillary Clinton once said, “Graduates from four-year colleges earn nearly an estimated one million dollars more [than high school graduates].” This may sound convincing, but this figure — based on a Census Bureau report — is about as true as it is relevant.

After all, isn’t it true that the most hard-working and intelligent people tend more to go to college? This is not a nature vs. nurture argument, the factors behind these qualities are unrelated to the discussion at hand. If one grants, however, that the more ambitious and talented go to college in greater proportion than their peers, Mrs. Clinton could have just said “the most hard-working and intelligent earn nearly an estimated one million dollars more than their peers.” I think the presses need not be stopped.

For one thing, the Census Bureau estimate includes super-earners such as CEO’s which skew the average upward. Although some, such as Mark Zuckerberg and Bill Gates, didn’t graduate college, most did. This is why it’s better to use the median (the middle number in the data set) than the mean or average. It’s also why Hillary Clinton and other repeaters of this factoid don’t.

Furthermore, just because most smart people go to college doesn’t mean they should. They may earn more money, but what they keep is more important than what they make. Financial columnist Jack Hough created a very illuminating hypothetical scenario with two people, one who chooses college and one who enters the labor force after high school. Hough then uses the average cost of college as well as U.S. Census Bureau data for the average income of college graduates and non-graduates, adjusted for age. He assumes both save and invest 5 percent of their income each year. By the age of 65, how does the net worth of each look?

  • College Graduate: $400,000
  • High School Graduate: $1,300,000

When one thinks about the common narrative of college vs. no college, it truly becomes absurd. Indeed, who exactly are we comparing? We’re not only comparing Jane-Lawyer to Joe-Carpenter, but we’re also comparing financial analysts with the mentally disabled, medical doctors with welfare dependents, building engineers with drug addicts, architects with pan handlers, marketing directors with immigrants who can barely speak English, and university professors with career criminals (whose earnings, by the way, are rarely reported). Many of these troubled people didn’t graduate high school, but it is shocking how they shuffle kids through the system these days. Some 50 percent of Detroit high school graduates are functionally illiterate and it isn’t that much better for the country on the whole. And something tells me that these particular non-graduates need something other than four years of drinking and studying Lockean (well, more likely Marxian) philosophy.

It certainly could be a good thing to earn a college degree. If one wants to be an accountant, engineer, or doctor, a degree is required. And those jobs have very high incomes. But can one really expect to make a killing with a degree in sociology or Medieval-African-Women’s-Military-Ethnic Studies? Pretty much the only jobs those degrees help one get, in any way other than the “hey, they got a college degree” sort of way, are jobs teaching sociology or Medieval-African-Women’s-Military-Ethnic Studies. And that requires an advanced degree as well (i.e., more money down the tube).

Furthermore, a college degree does not even guarantee a particularly high income. CBS News ran an article on the 20 worst-paying college degrees. The worst was Child and Family Studies with a starting average salary of $29,500 and a mid-career average of $38,400. Art History came in 20th with a starting average of $39,400 and a mid-career average of $57,100. Other degrees in between included elementary education, culinary arts, religious studies, nutrition, and music.

These are decent salaries, but are they worth the monetary and opportunity costs? With the wealth of information on the Internet, many skills can be attained on one’s own. Alternatives to college such as entrepreneurship and apprenticeship programs are often ignored. Indeed, apprentices typically get paid for their work while they are learning. The average yearly wage of a plumber and electrician are $52,950 and $53,030 respectively. That’s better than many college degrees and comes without the debt.

And that debt is getting bigger and bigger as college tuition continues to rise. In the last five years, tuition has gone up 24 percent more than inflation. Including books, supplies, transportation and other costs, in-state college students paid an average of $17,860 for one year in 2013 (out-of-state students paid substantially more). And despite all of that, many students don’t even finish. According to US News & World Report,

Studies have shown that nonselective colleges graduate, on average, 35 percent of their students, while the most competitive schools graduate 88 percent. Harvard’s 97 percent four-year graduation rate might not be that surprising … [but then] Texas Southern University’s rate was 12 percent.

12 percent is simply ridiculous, but the 35 percent for nonselective schools is extremely bad as well. Even the 88 percent for competitive schools leaves 12 percent of their students with no degree, but plenty of debt.

Given all of that, it can’t be surprising that the default rates on student loans (which cannot be wiped away in bankruptcy) appear to be much higher than is typically reported. According to The Chronicle,

[O]ne in every five government loans that entered repayment in 1995 has gone into default. The default rate is higher for loans made to students from two-year colleges, and higher still, reaching 40 percent, for those who attended for-profit institutions …

[T]he government’s official “cohort-default rate,” which measures the percentage of borrowers who default in the first two years of repayment and is used to penalize colleges with high rates, downplays the long-term cost of defaults, capturing only a sliver of the loans that eventually lapse …

College is good for some people. If you want to go into a field that has high earning potential (engineering, medicine, accounting, etc.) or you really like a certain subject and want to dedicate your career to it even if it may not be the best financial decision, go for it. But don’t go to college just because as Colin Hanks says in Orange County, “that’s what you do after high school!”

Andrew Syrios is a Kansas City-based real estate investor and partner with Stewardship Properties. He also blogs at Swifteconomics.com. See Andrew Syrios’s article archives.

This article was published on Mises.org and may be freely distributed, subject to a Creative Commons Attribution United States License, which requires that credit be given to the author.

Charity, Compulsion, and Conditionality – Video by G. Stolyarov II

Charity, Compulsion, and Conditionality – Video by G. Stolyarov II

Libertarians’ opposition to coercive redistribution of wealth does not mean that they are opposed to charitable giving that improves people’s lives.

In this video, Mr. Stolyarov analyzes why private charities are more effective in benefiting their intended recipients than programs which involve coercive redistribution of wealth. Paradoxically, it is the extreme conditionality of many coercive welfare programs that leads them to be less effective than the voluntary decisions of diverse individuals and organizations.

References

– “The Costs of Public Income Redistribution and Private Charity” – James Rolph Edwards – Journal of Libertarian Studies – Summer 2007
In Our Hands: A Plan To Replace The Welfare State (2006) – Book by Charles Murray